
How to identify and resolve memory leaks in iOS
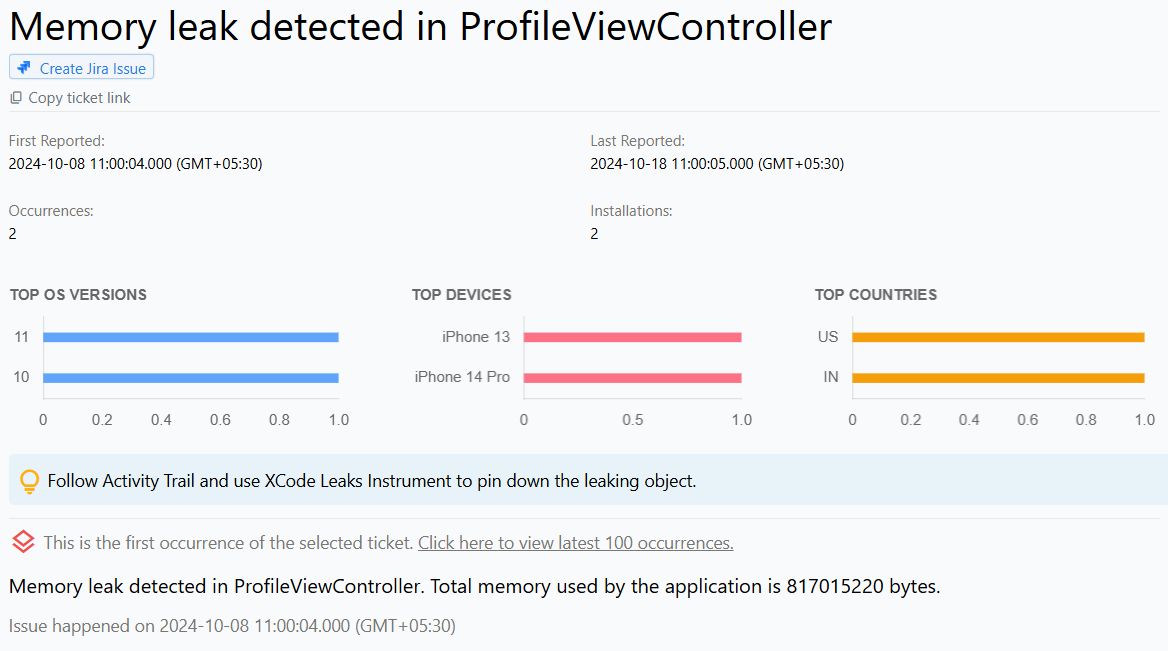
Memory Leak in iOS and iPadOS apps
Memory leaks in iOS and iPadOS apps occur when a programming issue causes the app to fail in releasing unused memory. As a result, the app gradually consumes more memory over time, leading to performance degradation and eventual crashes.
These memory leaks can negatively affect the user experience, making it crucial for developers to identify and resolve such issues to ensure the app functions efficiently and provides a smooth user experience.
Why does this happen?
Memory leaks in iOS and iPad apps can be caused by various factors. Some common reasons include:
Incorrect management of object references: This occurs when objects are not released when they are no longer needed, leading to unnecessary memory consumption.
Improper use of static variables: This can result in objects remaining in memory even after they are no longer required.
Retained resources: Using too many resources, such as bitmaps, cursors, or file streams, without releasing them can also contribute to memory leaks in an application.
How to fix it using Appxiom
- Locate issue report: The issue report provides the name of the UIViewController where the leak occurred, as well as an activity trail. The activity trail is a chronologically ordered list of events that occurred prior to the memory leak issue, allowing developers to trace the events leading up to the problem.
- Trace activity trail: By following the activity trail, developers can use the Xcode Leaks instrument in the debug environment to pinpoint the exact object causing the leak.
Stop guessing. Start fixing.
Get real-time alerts, exact stack traces, and complete activity trails before these issues impact your revenue.
We use cookies to improve your experience.