
Detect & Fix High or Abnormal Memory Usage in Flutter Apps
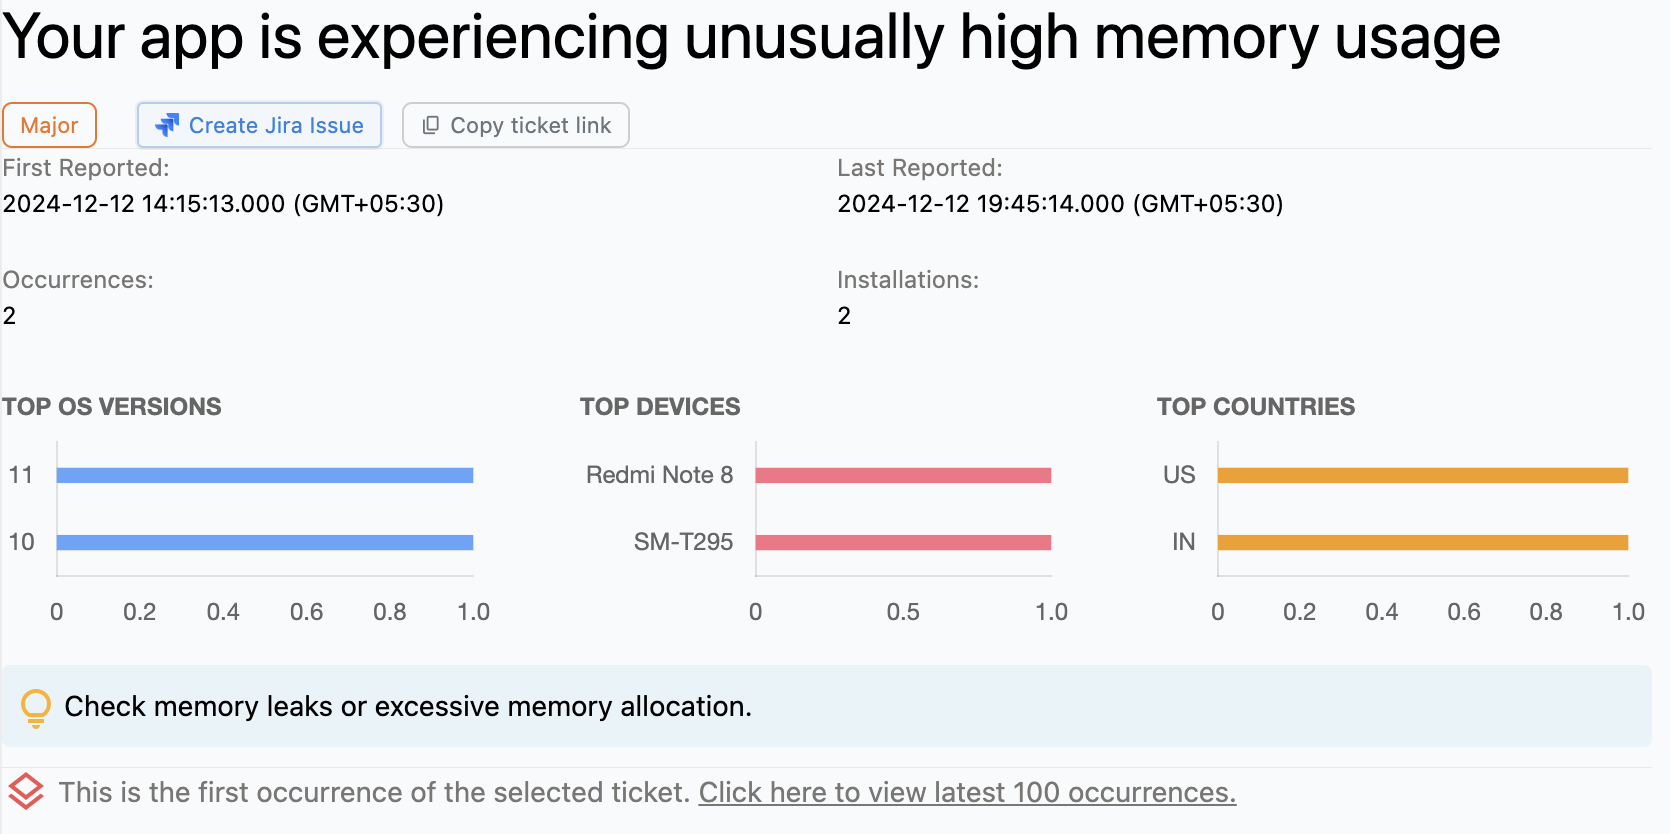
High or abnormal memory usage in Flutter apps
High memory usage issue, often referred to as a memory bloat, in Flutter apps refers to a situation where the application consumes a disproportionate or excessive amount of memory on a device. This is often a clear indication of some form of inefficiency in the app's memory management.
The high memory usage can lead to a variety of problems, including slow performance of the app and the device overall, the app freezing or becoming unresponsive, crashes, or even premature termination of the app by the system to free up resources.
When a Flutter app uses too much memory, it can not only hinder its own performance but also potentially impact the performance of the entire device. It can cause the device to slow down, become unresponsive, or even crash in extreme scenarios.
Why does this happen?
High memory usage in Flutter apps can be attributed to various reasons:
Large images or media files: These files, if not optimized for mobile devices, can take up a significant amount of memory, causing the app to slow down, become unresponsive, or crash.
Inefficient memory management: This can occur when the app fails to free up memory that is no longer needed, leading to a condition known as a memory leak. Such inefficiencies can cause the app's memory usage to rapidly increase, leading to noticeable performance issues.
Too many background processes: These processes, while not always visible to the user, can consume a substantial amount of memory, leading to the overall slowdown of the device, especially if they are complex or not optimized for efficient memory usage.
How to fix it using Appxiom
- Locate issue report: The issue report provides the name of the activity along with the activity trail, which is a chronologically ordered list of events that occurred prior to this issue. The report also includes the amount of memory used by the app at each event.
- Isolate memory increases: This information can help developers isolate the area or activity that is causing the increase in memory usage.
Stop guessing. Start fixing.
Get real-time alerts, exact stack traces, and complete activity trails before these issues impact your revenue.
We use cookies to improve your experience.